Equilibrium Climate Sensitivity
An important tool used to estimate the magnitude of future climate change is the Equilibrium Climate Sensitivity (ECS), which is the eventual temperature increase resulting from a doubling in atmospheric carbon dioxide (Figure 1). In 1906 Svante Arrhenius calculated ECS as 4°C (Andrei G. 1998), which aligns remarkably well with the Intergovernmental Panel on Climate Change (IPCC’s) most recent likely range of 2.5-4.0°C (with a best estimate of 3.0°C) (IPCC 2023).
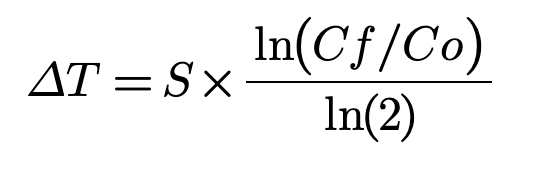
Figure 1. This equation was discovered by Arrhenius defining delta T, temperature change. S is the Equilibrium Climate Sensitivity, Cf is the final concentration of CO2, and Co is the initial concentration (Kunreuther et al. 2013).
However, it is here where we encounter one of the most pressing issues in climate science. A “likely” range in IPCC lexicon means a 66% chance. This admits a “very likely” range of 2.0-5.0°C, with a 90% chance that climate sensitivity exceeds 4.0°C. The continuation of current policies is likely to result in 2.8°C of warming, but there remains a chance that the same level of emissions results in massively more warming if ECS is, in reality, higher than 3.0°C (IPCC 2023).
Hothouse Earth
Surface warming of a magnitude >4.0°C would have catastrophic implications for humans. Not only are extreme weather and temperature events, sea level rise, crop failure, and biodiversity loss drastically worsened, but >4.0°C warming increases the risk of unleashing a “tipping-cascade”, where the collapse of certain climate systems results in further collapses, accelerating warming out of human control (Kemp et al. 2022).
Fat-tail Distributions
Current policy estimates place median warming at 2.8°C, making >4.0°C unlikely (IPCC 2023). However, the COVID-19 Pandemic was unlikely. Hurricaine Katrina was unlikely. In statistics such possibilities are referred to as “fat-tails”. Under a normal distribution, moves beyond three standard deviations from the mean are effectively impossible (<0.3%). However, some systems have a “fat-tail distribution”, in which the probability of extreme events is higher than in a normal distribution (Cooke et al. 2014). ECS is “heavy-tailed” (see Figure 2), as values below 1.5°C have been effectively ruled out, but there remains a significant chance ECS exceeds 4.5°C (IPCC 2023 and Kunreuther et al. 2013).
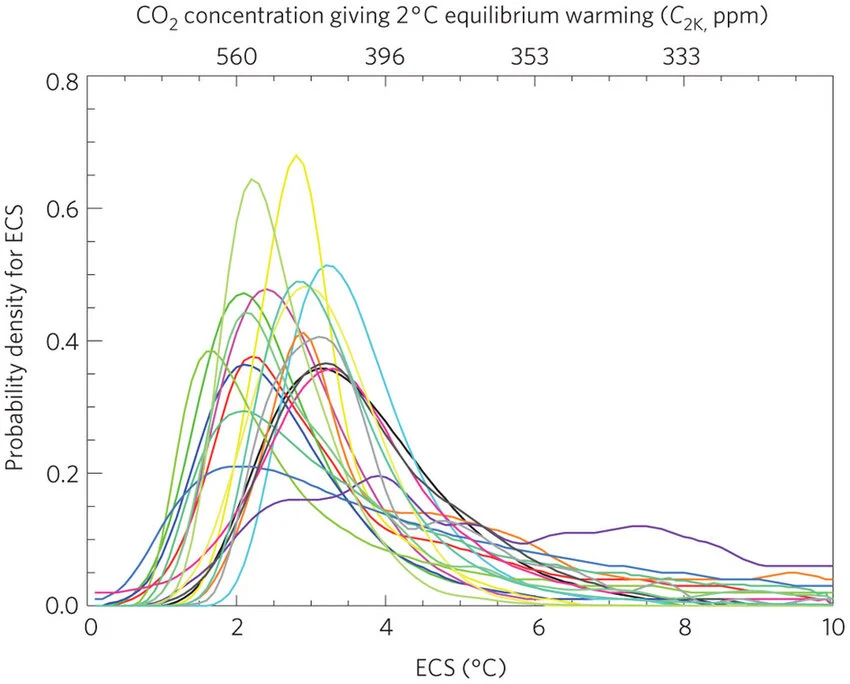
Figure 2. Probability density function of Equilibrium Climate Sensitivity, showing a significant “heavy-tail”. Each coloured line represents a different climate sensitivity model (Kunreuther et al. 2013).
The Uncertainty Monster
This ambiguity in future climate crises gives rise to the “Uncertainty Monster”, a term coined by Dutch sociologist Jeroen van der Sluijs. Climate change lies in the realm of “scenario uncertainty”, where it is difficult to quantify how likely a single emission pathway is to occur, and “deep uncertainty” where there are significant “unknown unknowns” with regards to the mechanisms of climate models. Further research to reduce this uncertainty, which Van der Sluijs calls “Monster Exorcism”, is difficult because it often reveals a whole new layer of complexity which we were previously unaware of, requiring yet further re-analysis. “Statistical uncertainty”, where uncertainty can be precisely quantified and communicated, cannot be easily applied because of climate’s sheer complexity and many conflicting models (Curry 2023). For example, the CESM2 climate model predicts that ECS could exceed 5.0°C but many components of the CMIP6 model used by the IPCC do not, due to underlying differences in the simulation of cloud feedback systems (Bjordal et al. 2020).
Living with the Monster
The Uncertainty Monster is dangerous because it can breed inaction (Curry 2023). One study concluded that perceived ambiguity of climate science has been linked to lower public concern for climate change (Visschers 2017). However, there is virtually no uncertainty on the existence of anthropogenic climate change and that warming in excess of 1.5°C will still be very dangerous (IPCC 2023). Furthermore, we are also confident that reducing emissions will reduce the likelihood of catastrophic warming scenarios, even if we cannot precisely assess that likelihood (IPCC 2023). Therefore, this ambiguity actually does not impact policy decisions, which should be aimed towards reducing emissions as quickly as possible.
Bibliography
Bjordal, Jenny, Trude Storelvmo, Kari Alterskjær, and Tim Carlsen. 2020. “Equilibrium Climate Sensitivity Above 5 °C Plausible Due to State-Dependent Cloud Feedback.” Nature Geoscience 13 (11): 718–21. https://doi.org/10.1038/s41561-020-00649-1.
Cooke, Roger M., Daan Nieboer, and Jolanta Misiewicz. 2014. Fat-Tailed Distributions: Data, Diagnostics and Dependence. John Wiley & Sons.
Curry, Judith A. 2023. Climate Uncertainty and Risk: Rethinking Our Response. Anthem Press.
Deng, Huai, Xianhua Wu, Hui Xu, You Wu, and Xin-Zhong Liang. 2025. “Quantifying Aggregated Economic Damages From ‘Fat-Tail’ Extremes High-Temperature Events in Climate Change.” Structural Change and Economic Dynamics 75 (December): 108–21. https://doi.org/10.1016/j.strueco.2025.05.007.
Intergovernmental Panel on Climate Change (IPCC). 2023. “Climate Change 2023: Synthesis Report.” In Sixth Assessment Report of the Intergovernmental Panel on Climate Change. IPCC. https://www.ipcc.ch/report/ar6/syr/downloads/report/IPCC_AR6_SYR_FullVolume.pdf.
Kemp, Luke, Chi Xu, Joanna Depledge, et al. 2022. “Climate Endgame: Exploring Catastrophic Climate Change Scenarios.” Proceedings of the National Academy of Sciences 119 (34): e2108146119. https://doi.org/10.1073/pnas.2108146119.
Kunreuther, Howard, Geoffrey Heal, Myles Allen, Ottmar Edenhofer, Christopher B. Field, and Gary Yohe. 2013. “Risk Management and Climate Change.” Nature Climate Change 3 (5): 447–50. https://doi.org/10.1038/nclimate1740.
Lapenis, Andrei G. 1998. “Arrhenius and the Intergovernmental Panel on Climate Change.” Eos, Transactions American Geophysical Union 79 (23): 271–71. https://doi.org/10.1029/98eo00206.
Visschers, Vivianne H. M. 2017. “Public Perception of Uncertainties Within Climate Change Science.” Risk Analysis 38 (1): 43–55. https://doi.org/10.1111/risa.12818.
Wood, Richard A., Michel Crucifix, Timothy M. Lenton, et al. 2023. “A Climate Science Toolkit for High Impact‐Low Likelihood Climate Risks.” Earth’s Future 11 (4): e2022EF003369. https://doi.org/10.1029/2022ef003369.


Leave a Reply
You must be logged in to post a comment.