Imagine the room you’re sitting in, only 4.0°C warmer. Maybe you’re a little uncomfortable. The planet, 4.0°C warmer, is in crisis. Considered an extremely dangerous outcome by climate scientists, it would likely entail massive sea level rise, food and water scarcity affecting billions of people, and the collapse of the biosphere (Kemp et al. 2022; IPCC 2023). The risk of mass migration, vector-borne disease, and resource conflict would be greatly amplified (IPCC 2023).
So is this doomsday scenario likely? No, but it is far from impossible. Under the emission levels projected by current policies, ~2.8°C of warming can be expected by 2100 (UNEP 2025). This calculation relies on Equilibrium Climate Sensitivity (ECS), the eventual warming resulting from a doubling in atmospheric carbon dioxide (Figure 1). The Intergovernmental Panel on Climate Change (IPCC) most recent likely range for ECS is 2.5-4.0°C (IPCC 2023).
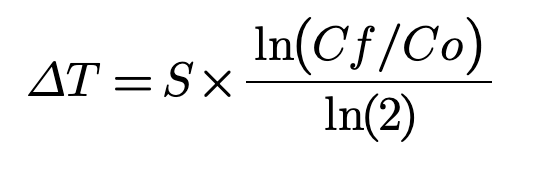
However, in IPCC lexicon “likely” means there is a 66% chance a value falls within a certain range (IPCC 2023). Values outside this range remain possible—crucially, there is an 18% chance that ECS exceeds 4.5°C, which would result in much more warming given the same emission scenario (Kemp et al. 2022). Multiple models have assessed ECS with varying results, but a general trend can be observed: ECS has a “fat-tail” (Figure 2) (Curry 2023). In a fat-tail distribution extreme values have a much higher probability than in a normal distribution (where values beyond three standard deviations from the mean occur at <0.3%) (Cooke et al. 2014).
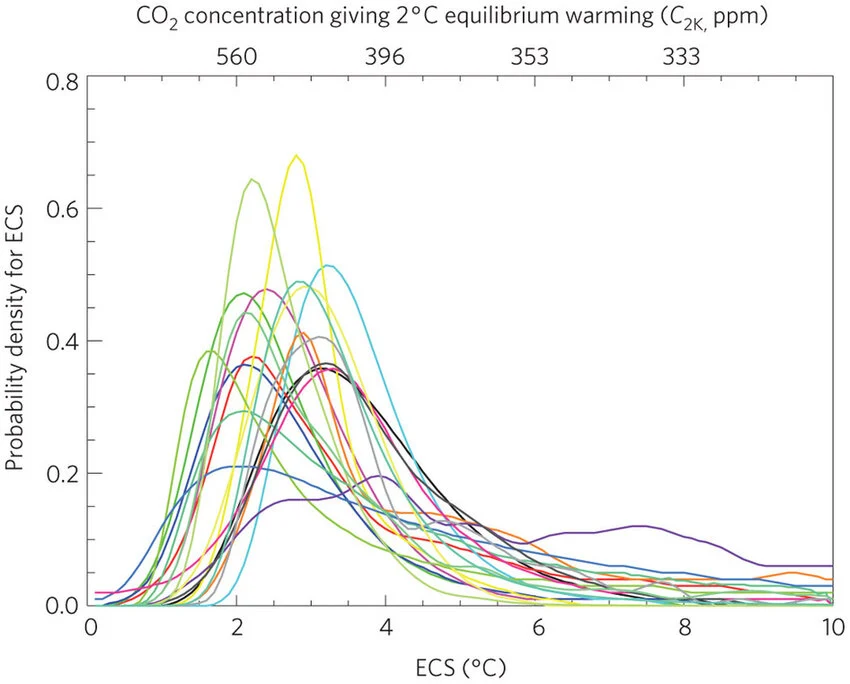
Significant uncertainty is attached to estimating the fatness of the tail (how likely the worst outcomes are). Unlike when, say, performing a titration, the sheer complexity of climate models means that we cannot easily calculate statistical uncertainty, which can be precisely quantified (Curry 2023). The IPCC often relies on qualitative terms like “high confidence” to communicate the amount of evidence for a claim (IPCC 2023). Furthermore, predictions become increasingly less certain for more extreme warming scenarios. There are simply too many “unknown unknowns” (referred to as deep uncertainty) (Curry 2023). For example, some scientists theorize that at sufficiently high concentrations of CO2 stratocumulus cloud decks could be lost, causing an additional ~8°C of warming. However, we don’t know enough about how the climate will behave under these extremes to definitively prove this false, and we can’t determine exactly how unlikely it is (Bjordal et al. 2020).
There is sometimes a public tendency to conflate scientific uncertainty with a lack of consensus (Visschers and Vivianne H. M. 2017). One study found that expressing uncertainty regarding worst-case climate-change decreased trust in scientists (Howe et al. 2019). Another found that certain expressions of low-probability uncertainties in climate change lead to a perception of low scientific consensus and conclusions being less evidence-based (Juanchich et al. 2025). However, uncertainty is inherent in calculating future climate change, especially concerning extreme ECS scenarios. It is critical to remember that regardless of their exact probability, we are certain they are less likely under lower emission scenarios (IPCC 2023). Thankfully, unlike ECS, emissions are something we can control.
Bibliography
Bjordal, Jenny, Trude Storelvmo, Kari Alterskjær, and Tim Carlsen. 2020. “Equilibrium Climate Sensitivity Above 5 °C Plausible Due to State-Dependent Cloud Feedback.” Nature Geoscience 13 (11): 718–21. https://doi.org/10.1038/s41561-020-00649-1.
Cooke, Roger M., Daan Nieboer, and Jolanta Misiewicz. 2014. Fat-Tailed Distributions: Data, Diagnostics and Dependence. John Wiley & Sons.
Curry, Judith A. 2023. Climate Uncertainty and Risk: Rethinking Our Response. Anthem Press.
Howe, Lauren C., Bo MacInnis, Jon A. Krosnick, Ezra M. Markowitz, and Robert Socolow. 2019. “Acknowledging Uncertainty Impacts Public Acceptance of Climate Scientists’ Predictions”Nature Climate Change 9(11): 863–67. https://doi.org/10.1038/s41558-019-0587-5.
IPCC (Intergovernmental Panel on Climate Change). 2023. Climate Change 2023: Synthesis Report. Contribution of Working Groups I, II and III to the Sixth Assessment Report of the Intergovernmental Panel on Climate Change. Edited by Core Writing Team, Hoesung Lee, and José Romero. Geneva, Switzerland: IPCC. doi: 10.59327/IPCC/AR6-9789291691647
Juanchich, Marie, Karl Halvor Teigen, Theodore G. Shepherd, and Miroslav Sirota. 2025. “Negative Verbal Probabilities Undermine Communication of Climate Science”Nature Climate Change 15(12): 1300–1306. https://doi.org/10.1038/s41558-025-02472-1.
Kemp, Luke, Chi Xu, Joanna Depledge, et al. 2022. “Climate Endgame: Exploring Catastrophic Climate Change Scenarios.” Proceedings of the National Academy of Sciences 119 (34): e2108146119. https://doi.org/10.1073/pnas.2108146119.
Lapenis, Andrei G. 1998. “Arrhenius and the Intergovernmental Panel on Climate Change.” Eos, Transactions American Geophysical Union 79 (23): 271–71. https://doi.org/10.1029/98eo00206.
United Nations Environment Programme. 2025. Emissions Gap Report 2025: Off target – Continued collective inaction puts global temperature goal at risk. Edited by Olhoff, A., chief editor; Lamb, W.; Kuramochi, T.; Rogelj, J.; den Elzen, M.; Christensen, J.; Fransen, T.; Pathak, M.; Tong, D. https://doi.org/10.59117/20.500.11822/48854.
Visschers, Vivianne H. M. 2017. “Public Perception of Uncertainties Within Climate Change Science.” Risk Analysis 38 (1): 43–55. https://doi.org/10.1111/risa.12818.
Comments
13 Responses to “Doomsday Math: The “Fat-Tail” Risks of Climate Change”
Hi all, the idea for this post actually came from the physics lab where we were quantifying uncertainty, and I wondered how one could possibly quantify the uncertainty of more complex systems with countless real-world interactions. I may have bitten off more than I can chew and intend to make many edits, especially aimed at reducing word count and improving the clarity of my ideas. Any suggestions are welcome.
Thanks,
Gavin
Hi Gavin,
I really liked your blog post. I found it really interesting, and it ties into the 3rd-year climate change content quite nicely!
A few suggestions for your edits:
1. It’s a bit hidden, but there is a caption option when you press images; it could help to differentiate the figure caption from the main text.
2. In P3, I would also add ‘A’ to the beginning of the sentence ‘surface warming of a magnitude…’
3. I would also add a bit of a transition to improve flow in P4 between the current policy estimate and when you add in your COVID-19 and Hurricane Katrine comments. Maybe something along the lines of ‘but this doesn’t factor in for unpredictable events like COVID-19 or Hurricane Katrina’
4. Also, there’s a small typo for hurricane in P4.
5. I would also try to cite Jeroen van der Sluijs’s article in which the term was coined.
Great blog post, excited to see the final copy!
Happy editing,
Bohmie
Hi Bohmie! Thanks so much for the tip about captions I was struggling with that one. I did end up overhauling a lot of my original text to reduce word count and become more clear. As much as I liked the van der Sluijs segment, I actually had a really difficult time finding the original paper. In retrospect I also thought it was probably too close to plagiarism to quote him in the context of climate change, when my only source was another article doing the exact same. Thanks! Gavin
Hi Gavin,
Your blog topic was really interesting and I like how you organized the information with headings. Here are a few suggestions:
P1: Double check your in-text citation of Andrei G. 1998 as I cannot see this in the references.
P3, S2: I like how you define what a tipping cascade is, but this sentence is a little long. Perhaps you can divide it into 2.
P4, last sentence: When you have an in-text citation with two sources, you can use a semi-colon to separate both. For example (PCC 2023; Kunreuther et al. 2013).
Happy editing,
Ria
Hi Ria! Thanks for the advice. The Andrei G. 1998 citation was in the bibliography, but I forgot to include the other author, Lapensis (who comes first alphabetically). Good catch! Thanks so much for the tip about multiple citations, I’ve been guessing on that one for way too long. I did remove mention of tipping cascades because I felt they would probably deserve their own blog post too explain properly. They are an important root cause of uncertainty in ECS and climate change, but I wanted to focus on connecting the statistics themselves to uncertainty and public interpretation of uncertainty. Thanks! Gavin
Hi Gavin,
Your blog post was very informative and was an interesting read. Your graph was explained well and I liked the point you made in your last paragraph. I just have a few suggestions:
P2: I was a bit confused with this paragraph, maybe try explaining where the “likely” range being 66% came from and how the “very likely” range is from 2.0-5.0 degrees.
P3: I liked this paragraph, but perhaps you could make it a bit more concise, especially if you’re worried about your word count since this is more of a side point to your main topic.
References: Consider making the links to your references hyperlinks for easier access to sources.
Good luck and I’m excited to read your final draft!
Cheron
Hi Cheron, thanks for commenting so quick! The whole likely/very-likely range thing I eliminated. It’s a funny illustration of how confusing IPCC statistics language can be, but I forgot to explain it properly so ironically that part was just as confusing. I also greatly reduced my explanation of fat-tail statistics. Thanks for reading, and for the advice! Gavin
Hi Gavin,
I really liked your title! Your blog post was really interesting to read. Here are a few suggestions to keep in mind while editing:
-Consider adding an introductory sentence before jumping into the ECS to draw your reader in.
-Also, you may want to split the second sentence in P3 into two for better flow. Maybe something like this: “Not only are extreme weather and temperature events, sea level rise, crop failure, and biodiversity loss drastically worsened, but >4.0°C warming increases the risk of unleashing a “tipping-cascade”. In this scenario, the collapse of certain climate systems results in further collapses, accelerating warming out of human control.”
-Also, I think for Chicago author-date format it should be titled as ‘references’ at the end, not ‘Bibliography’.
Overall, great job! I can’t wait to read the final!
Happy editing
Tessa
Hi Tessa! As mentioned above, introductory sentence is hopefully present. Thanks for the tip about Chicago Style! I largely re-wrote the section about tipping-cascades because I thought that properly explaining their implications would extend the word count further. They are largely responsible for a lot of the unpredictable fat-tails on ECS measurements, but I simplified this in my final draft. Thanks so much for reading my post and for the suggestions! Gavin
Hi Gavin,
Really interesting post, here are some suggestions as you move onto editing:
– If your word count allows, add in an introduction to hook your reader at the start! For example you could say something along the lines of: How will climate change impact the Earth in the future? The short answer is, we’re not sure. Climate change models are constantly evolving, and because there are so many uncertainties and unknown variables, there is no easy answer to this question.
– In your Hothouse Earth paragraph, consider splitting up the second sentence, as it is very long right now, which makes it slightly confusing when reading it.
– I would recommend centering your figures and the figure captions
Overall great work, and super interesting post that tackles the complexity of understanding climate change.
Good luck editing,
Alexandra 🙂
I tried to add a brief introduction in the new draft, thanks for the tip! I originally had a metaphor I really liked but it got too complicated and hence the word count became too long. In my new intro I attempt to emphasize the stakes of a high ECS global warming scenario, essentially putting the Hothouse Earth paragraph towards the beginning. I also tried to split that paragraph up into more concise items and a better flowing list. The figures do appear centred to me now, so hopefully it shows up the same on your end. Thanks! Gavin
Hi Gavin,
I liked how your headings gave the topic a creative spin, particularly the connection between “The Uncertainty Monster” and “Living with the Monster.”
I have a few suggestions:
1) In the second paragraph, I was a bit confused because you give a 66% chance of climate sensitivity falling between 2.5 and 4.0°C, but then a 90% chance of exceeding 4.0°C. Those probabilities don’t seem to fit together, so I checked the IPCC source. It looks like 90% applies to the wider 2.0 – 5.0°C range, which includes more possible outcomes. I could be reading it wrong, but I would double check the wording to clarify what the percentage refers to.
2) In the fat-tail paragraph, I’d change “effectively impossible” to “very unlikely.” Since you’re making the point that we shouldn’t dismiss unlikely events, calling them impossible here feels a bit at odds with that. “Very unlikely” would still get across how rare they are without suggesting that they can’t happen.
Happy editing!
Gelila
Hi Gelila! Thanks for the comment, these are both definitely true. I knew about the functioning of the IPCC probability ranges, but I didn’t explain this clearly enough. In the redraft I omitted mention of the 90% range because it’s really confusing and explaining it properly would take too long (it took me a while and I was reading the primary source). Instead I wrote about an independent statistic for extreme ECS values above 4.5C. Furthermore, I omitted “effectively impossible” to a neutral description of the odds under a normal distribution (<0.3% after 3 SDs from the mean). I originally intended to emphasize how in normal distributions (unlike fat-tail distributions) the chance that a very extreme event occurs is immensely low, but I understand how this could easily be confused for a general statement that extreme events are impossible.