Voxel-wise modeling (VM) bridges neuroscience and computation by transforming brain imaging data into mathematical relationships between stimulus features and brain activity. It’s a framework that associates aspects of natural stimuli, such as images or sounds, with responses in individual brain voxels (Yılmaz et al. 2020).
A voxel, or volume element, represents a tiny cube of brain tissue in 3D imaging (Gerber and Peterson 2008). Voxels are the building blocks of brain scans: each contains a measurement of neural or hemodynamic activity, allowing for the study of how cognition unfolds in space and time. Voxels are like pixels, except instead of forming a flat image, they form a 3D map of the brain (Figure 1).
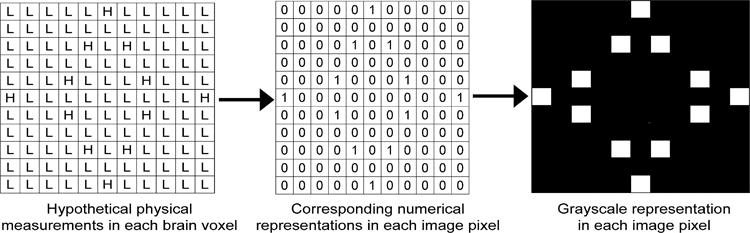
Figure 1. Left: each square represents a voxel, where a measurement (for example, signal intensity or blood oxygen level) is taken. Here, “H” and “L” indicate high or low signal levels. Middle: measurements are converted into numerical codes that computers can read, where each voxel’s signal becomes a value, such as 0 or 1, representing different activity levels. Right: numerical data are then translated into an image. Although binary in this example, levels of grayness can correspond to the voxel’s value (Gerber and Peterson 2008).
Because voxel-wise modelling uses the time series measured in each voxel as the model’s dependent variable, it is necessary to describe what that measurement can represent in functional MRI: the blood-oxygenation-level-dependent (BOLD) signal. These signals are an indirect measure of neural activity that arises from local changes in blood oxygenation, blood volume, and blood flow following neuronal activation (LeBel et al. 2021). In voxel-wise modelling, the BOLD time series recorded in each voxel serves as the dependent variable in mathematical encoding models that relate specific stimulus features. This allows for the prediction of voxel-level responses from stimulus information, and the assessment of how complex cognitive functions are spatially organized across cortical regions (LeBel et al. 2021). In other words, the BOLD response is an indirect proxy for neural activity by measuring hemodynamic consequences rather than electrical firing itself.
Figure 2 illustrates an example of voxel-wise distributions of the BOLD signal magnitude at the stimulus frequency across brain slices, in response to visual stimulation. Each voxel’s colour intensity represents the coherence of its hemodynamic response, revealing regions where signal oscillations match visual-task timing (Huang et al. 2018). Higher magnitudes (in red and yellow) indicate stronger synchronization with the stimulus, showing that both gray and white matter contain voxels exhibiting task-related periodicity. This voxel-level analysis demonstrates how frequency-domain modelling of BOLD time series can identify functionally connected areas without predefined regions of interest, supporting the presence of stimulus-locked neural activity distributed throughout the brain (Huang et al. 2018).
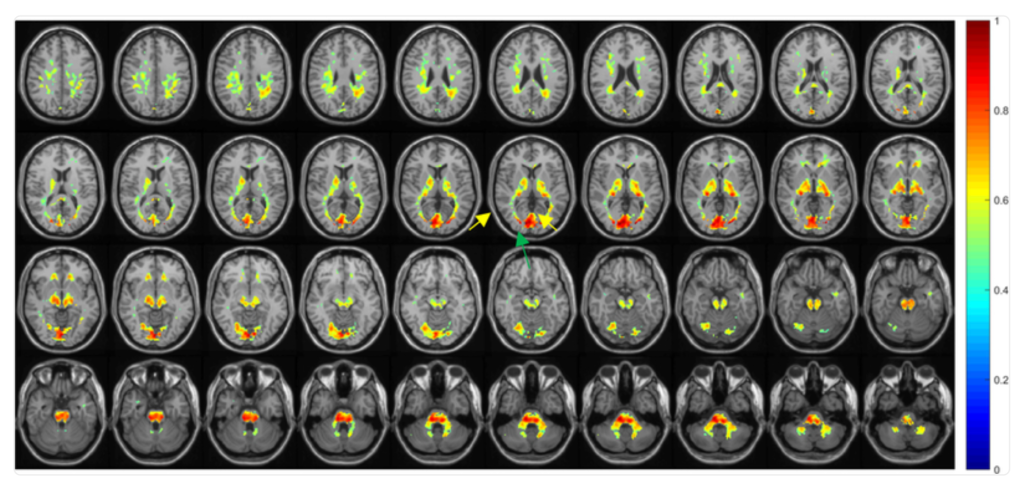
Figure 2: Voxel-wise map of the BOLD signal magnitude during visual stimulation. Each coloured spot represents a voxel, where the brightness indicates how strongly that voxel’s BOLD signal synchronized with the visual stimulus. Warmer colours (yellow and red) show voxels with higher coherence (regions whose hemodynamic responses closely matched the timing of the visual task) (Huang et al. 2018).
While VM is a viable measure of localized brain activity, it has its limitations. This approach treats each voxel as an independent unit, which neglects spatial correlations and distributed neural dynamics across brain regions (Madhyastha et al. 2018). Additionally, VM models assume consistent effects over time, which can misrepresent non-linear or region-specific trajectories in brain development.
VM is a fascinating way to interpret the brain’s dynamic responses to complex stimuli, by bridging raw data and cognitive function. However, addressing spatial and temporal limitations is necessary for future applications.
References
Gerber, Andrew J., and Bradley S. Peterson. 2008. “What Is an Image?” Journal of the American Academy of Child & Adolescent Psychiatry 47 (3). https://doi.org/10.1097/CHI.0b013e318161e509.
Huang, Yali, Stephen K. Bailey, Peiguang Wang, Laurie E. Cutting, John C. Gore, and Zhaohua Ding. 2018. “Voxel-Wise Detection of Functional Networks in White Matter.” NeuroImage 183 (December). https://doi.org/10.1016/j.neuroimage.2018.08.049.
LeBel, Amanda, Shailee Jain, and Alexander G. Huth. 2021. “Voxelwise Encoding Models Show That Cerebellar Language Representations Are Highly Conceptual.” Research Articles. Journal of Neuroscience 41 (50). https://doi.org/10.1523/JNEUROSCI.0118-21.2021.
Madhyastha, Tara, Matthew Peverill, Natalie Koh, et al. 2018. “Current Methods and Limitations for Longitudinal fMRI Analysis across Development.” Developmental Cognitive Neuroscience, Methodological Challenges in Developmental Neuroimaging: Contemporary Approaches and Solutions, vol. 33 (October). https://doi.org/10.1016/j.dcn.2017.11.006.
Yılmaz, Özgür, Emin Çelik, and Tolga Çukur. 2020. Informed Feature Regularization in Voxelwise Modeling for Naturalistic fMRI Experiments. 52 (5). https://doi.org/10.1111/ejn.14760.
Comments
7 Responses to “Mapping the Mind in 3D: Voxel-Wise Modeling”
Hello iSci!
Since I did a bit of neuroimaging research this summer, I wanted to explore different applications/methods of data processing and analysis, which is why I chose to research voxel-wise modelling. I aimed to bridge concepts from both the biology and physics part of neuro from second year, as well as a bit of computational discussion. I welcome any editorial suggestions!
Hi Oviya,
I usually avoid blogposts on neuro topics because of second year, but this was very well written and informative. I just have a few suggestions:
– P3: I think that you would need to state what fMRI means. Magnetic Resonance Imaging (MRI) is standard knowledge I would assume, but I do not know if the f part is.
– P3S2: Avoid starting sentences with acronyms. You could replace it with “These” to avoid stating it twice.
– P4: If word count permits, perhaps you could explain what was being observed in the Voxel-wise map example (like what was the purpose for that specific scan). It would just give further context to the colours being shown on the different portions of the brain.
Hope this helps!
– Kye
Hello Kye,
Great suggestions! I incorporated them all, thank you for your feedback!
– Oviya
Hi Oviya!
Great blog post, super interesting and easy to understand. Just a few small things:
– In your first paragraph, you end by mentioning voxels, and then you reintroduce them at the start of your next paragraph before explaining them. It might flow better to remove the “This framework is based on voxels.” or to not mention voxels in the first paragraph.
– In your figure 1 caption (right), you say “level of grayness,” but there is only black and white depicted in the image. Can it be shades of gray other than black or white, or is it binary?
– If you have any room, it would be interesting to quickly compare other specific methods of measuring neural activity in your limitations section.
Great post overall and happy editing!
Fireese
Hi Fireese,
Voxels can be shades of grey! I edited the figure caption so hopefully it makes more sense now. Thanks for your suggestions!
– Oviya
Hi Oviya
This was a really clear and well-structured post, I really liked how you made it interdisciplenary and tied in the biological and computational aspects of neuroimaging. I have a few small suggestions that might want to implement:
– You do a great job describing what’s shown in the figures, but you could strengthen the connection between the blog and visuals by explaining how these figures help illustrate VM (e.g. Figure 1’s translation of data links to BOLD analysis in Figure 2).
– If you have the word count, maybe add a brief example of how VM is used in current neuroscience research
–The transition from defining voxels to explaining BOLD could be smoothed out with a short linking sentence, perhaps for better sentence flow.
Great job overall, good luck editing!
Arham
Hello Arham,
Your suggestions were helpful, I incorporated them all. Thanks for the feedback!
– Oviya